DIW Economic Outlook Autumn 2026
German economy grows, but not on its own strength - global economy stays on course
- German economy proving more resilient than expected in early summer, above all thanks to unexpectedly strong exports and expansionary fiscal policy
- DIW Berlin raises its economic forecast substantially and expects growth of 1.2 percent this year, 1.0 percent next year, and 0.7 percent in 2028
- But the recovery rests on shaky ground: high gas prices, low water levels, and structural weaknesses are slowing the economy in the second half of the year
- Setbacks also loom should the Strait of Hormuz remain closed for longer or the investment boom in artificial intelligence end abruptly
- Global economy likely to grow by 3.2 percent in both 2026 and 2027, and by 3.4 percent in 2028
German Economy
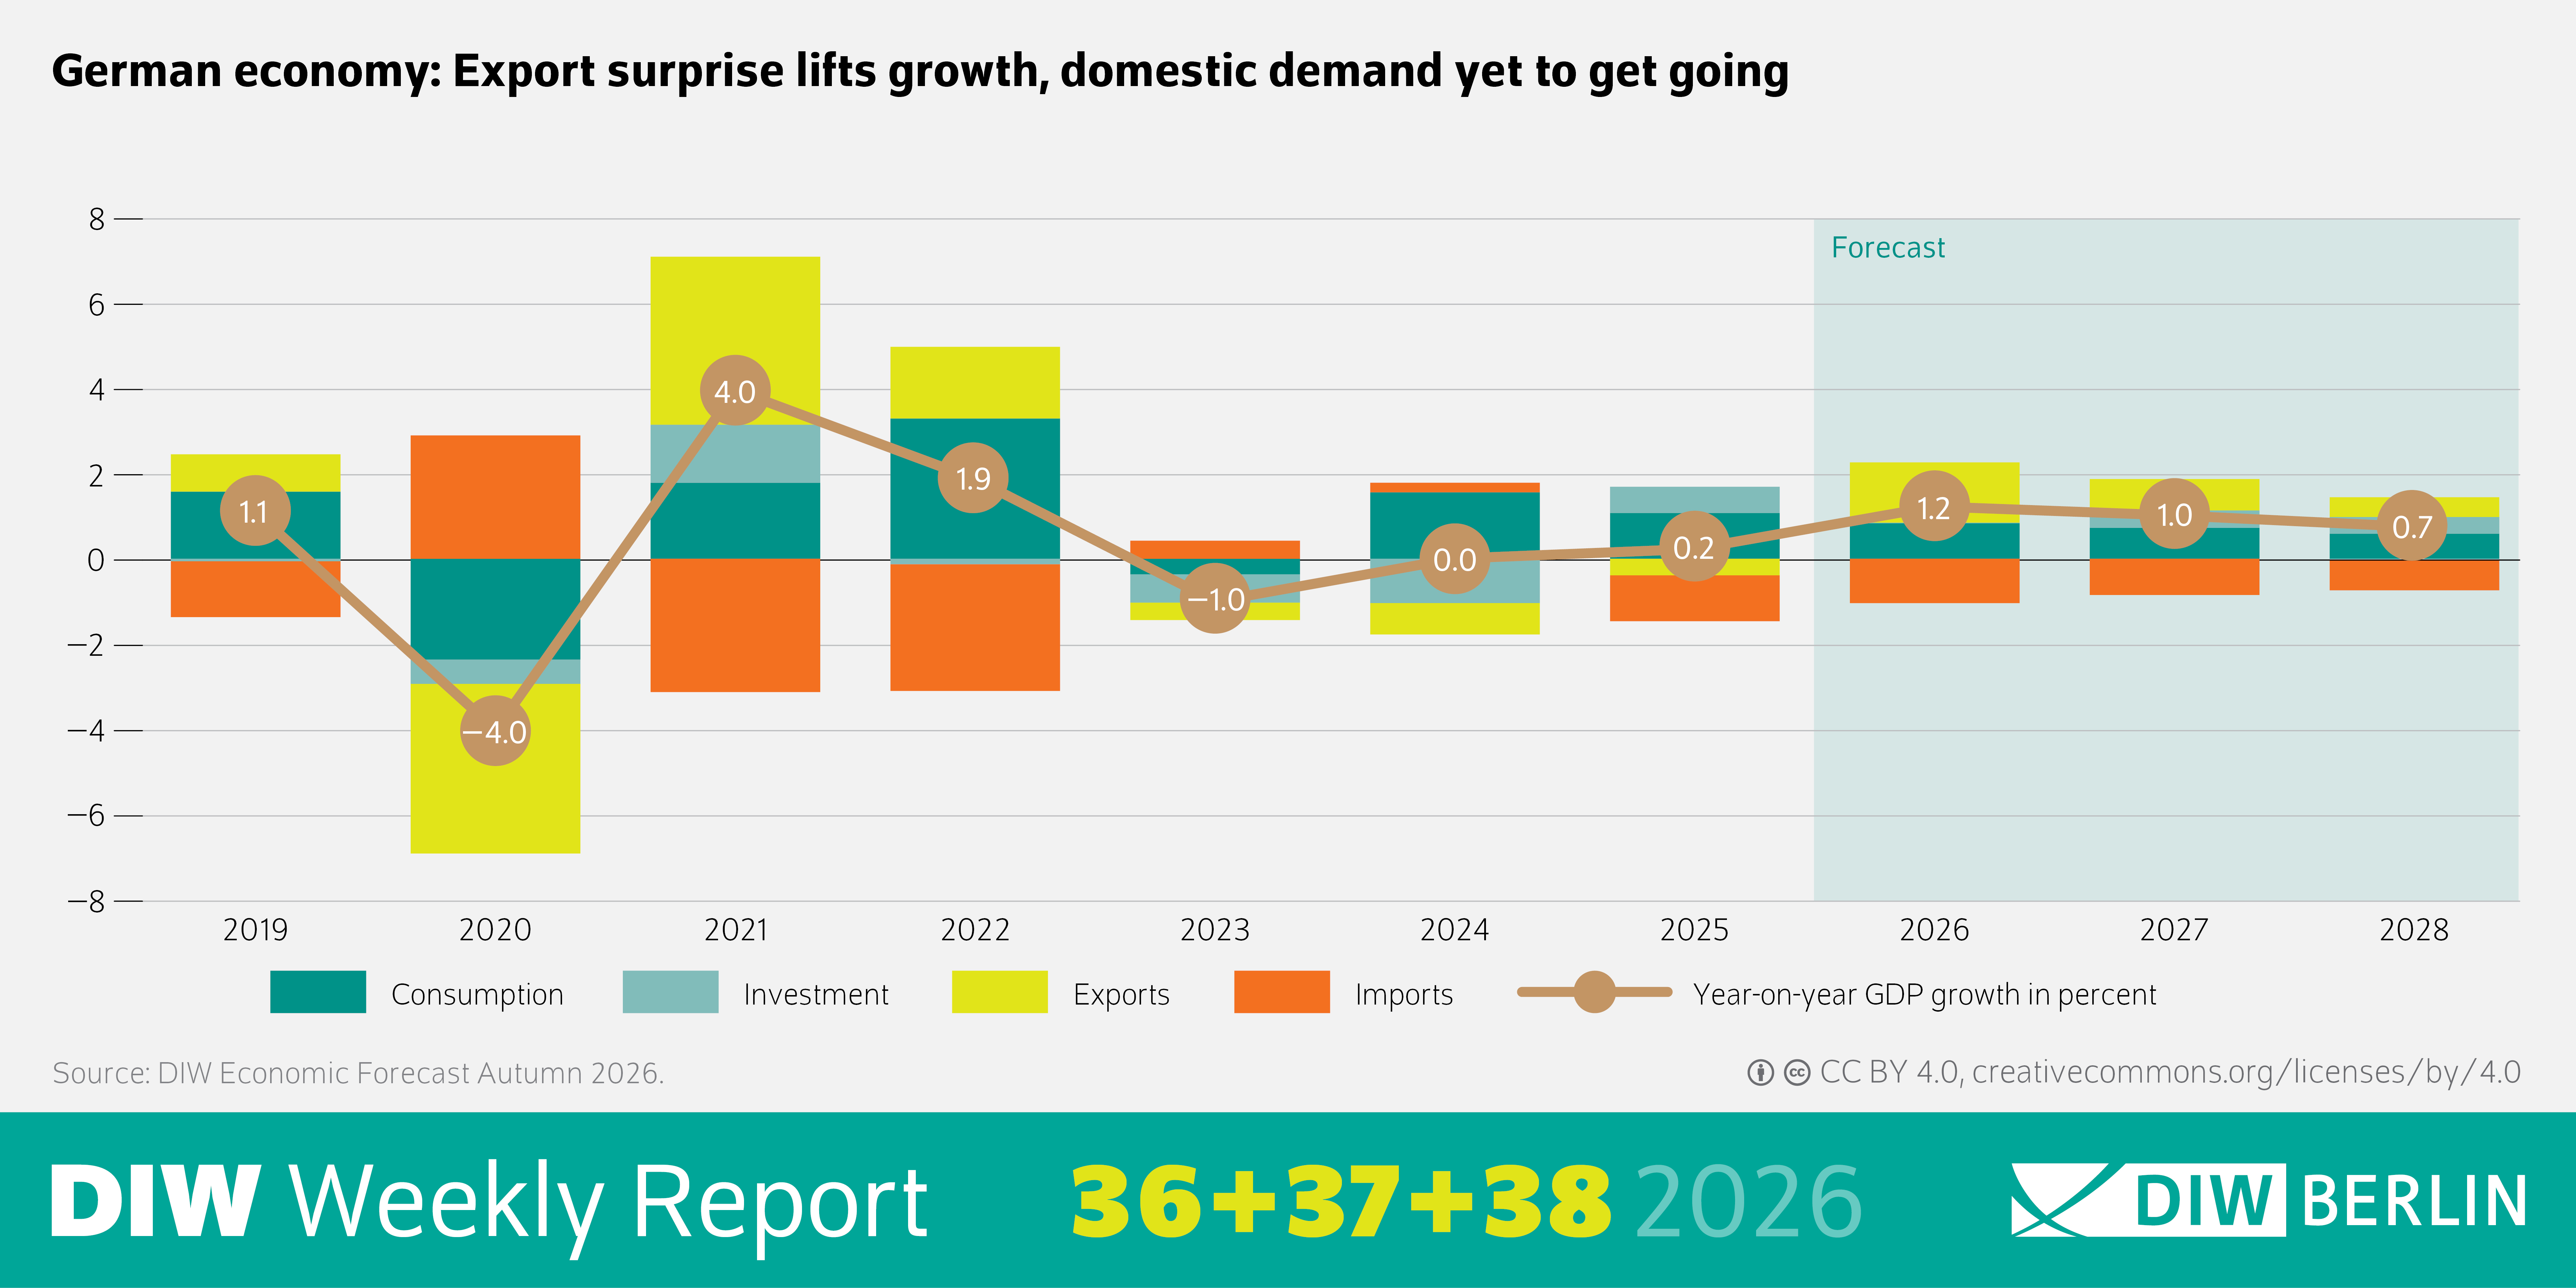
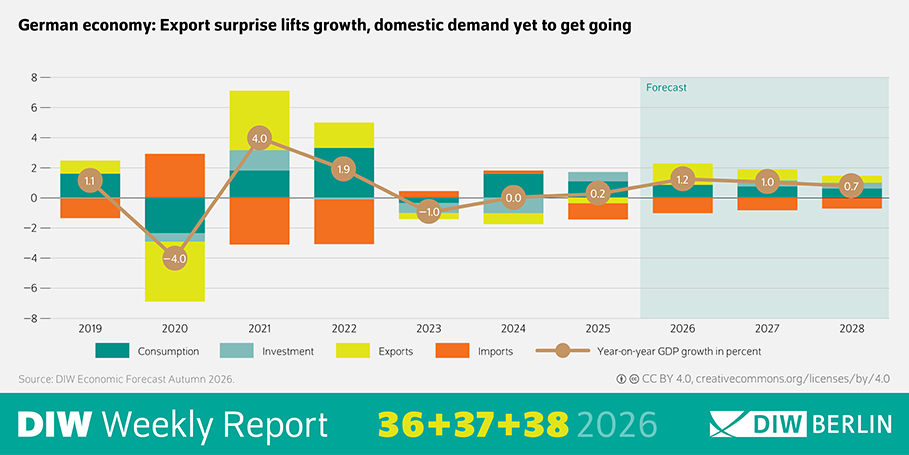
German economy: Export surprise lifts growth, domestic demand yet to get going
The German economy has proved more resilient this year than expected in early summer. The energy price shock from the Iran war has been milder than assumed. Despite the unprecedented supply outage in the Gulf region, oil prices rose only moderately, as supply was expanded elsewhere at the same time. Natural gas is a different story: prices there are now expected to be higher than assumed in the summer, and low storage levels are likely to make themselves felt in early 2027. A vigorous recovery therefore rests on shaky ground.
Gross domestic product expanded by 0.3 percent in the second quarter, driven largely by foreign trade. Exports rose unexpectedly strongly, by 2.0 percent, above all chemical and mineral oil products, most likely a pull-forward effect prompted by the uncertainty on energy markets. Domestic demand, by contrast, stayed subdued. Private consumption rose by just 0.1 percent, investment in machinery and equipment fell by 1.4 percent, and employment continued to decline. In the third quarter, economic output is likely to be roughly flat: low water levels on important rivers are hampering transport and production in the energy-intensive sectors, and high energy prices are dampening activity further.
How is the economy expected to develop in the coming years? How will gross domestic product (GDP) evolve this year and over the following two years?
Thanks to expansionary fiscal policy, price-adjusted gross domestic product should grow by 1.2 percent this year, and by 1.0 and 0.7 percent in the two years after that. DIW Berlin is thus raising its expectation for the current year by more than 0.5 percentage points against the summer forecast, almost entirely on the back of those unexpectedly strong second-quarter exports. Exports are unlikely to keep up that pace, though, as structural weaknesses such as declining competitiveness in key markets like China are still there. The robust global economy should at least support demand from abroad. DIW Berlin expects global output to grow by 3.2 percent both this year and next, and by 3.4 percent in 2028. Higher energy prices are weighing on activity in many places, but the investment boom in artificial intelligence and rising military spending are propping up demand at the same time, and as a producer of intermediate goods, the German economy stands to benefit from precisely that.
All in all, the recovery now under way remains a matter for the public sector, while Germany’s private sector is picking up only sluggishly. Consumer price inflation, at 2.7 percent this year and 2.6 percent next, is still well above the European Central Bank’s target. The central downside risk has meanwhile shifted from the oil market to the gas market: at the end of August, German gas storage facilities were only around 52 percent full. A cold winter or a renewed geopolitical escalation would keep inflation elevated for longer and dampen private demand.
What are the risks to the economic outlook?
Key economic indicators for the German economy
| 2025 | 2026 | 2027 | 2028 | |
|---|---|---|---|---|
| GDP1 | 0.2 | 1.2 | 1.0 | 0.7 |
| Employment2 (1,000 persons) | 45,878 | 45,684 | 45,687 | 45,821 |
| Unemployed (1,000 persons) | 2,948 | 2,992 | 2,928 | 2,720 |
| Unemployment rate3 (BA concept, in percent) | 6.3 | 6.4 | 6.2 | 5.8 |
| Consumer prices4 | 2.2 | 2.7 | 2.6 | 2.0 |
| Unit labor costs4,5 | 4.3 | 2.1 | 2.2 | 2.9 |
| Government budget balance6 | ||||
| in billions of euros | −136.5 | −192.5 | −224.6 | −219.0 |
| in percent of nominal GDP | −3.0 | −4.1 | −4.6 | −4.3 |
| Current account balance | ||||
| in billions of euros | 202.1 | 221.3 | 238.6 | 234.8 |
| in percent of nominal GDP | 4.5 | 4.7 | 4.9 | 4.6 |
1 Price adjusted. Year-on-year change in percent.
2 Domestic concept.
3 Unemployed as a percentage of the civilian labor force (definition according to the Federal Employment Agency).
4 Year-on-year change.
5 Compensation of employees per hour worked in Germany as a percentage of real GDP per hour worked.
6 As defined in the national accounts (Volkswirtschaftliche Gesamtrechnungen).
Note: Forecast from 2026 onward.
Sources: Federal Statistical Office; DIW Berlin Economic Outlook Autumn 2026.
“The German economy is recovering better than expected this year, but still rests on shaky ground. The rise in oil prices turned out to be surprisingly moderate despite the Iran war, while exports were supported by special factors. Neither, however, is likely to last.” Geraldine Dany-Knedlik, DIW-Konjunkturchefin
Global Economy
Despite the Iran War, the Global Economy Remains on Track
Real gross domestic product, consumer prices, and unemployment rate in the global economy
In percent
| GDP | Consumer prices | Unemployment rate in percent | ||||||||||
|---|---|---|---|---|---|---|---|---|---|---|---|---|
| Year-on-year percentage change | ||||||||||||
| 2025 | 2026 | 2027 | 2028 | 2025 | 2026 | 2027 | 2028 | 2025 | 2026 | 2027 | 2028 | |
| Europe | ||||||||||||
| European Union | 1.5 | 1.2 | 1.5 | 1.6 | 2.5 | 3.0 | 2.7 | 2.7 | 6.0 | 6.0 | 6.1 | 6.0 |
| Euro area | 1.3 | 0.9 | 1.2 | 1.2 | 2.1 | 2.8 | 2.2 | 2.3 | 6.4 | 6.4 | 6.3 | 6.2 |
| … excluding Germany | 1.9 | 0.8 | 1.3 | 1.2 | 2.0 | 2.8 | 2.8 | 2.1 | 7.4 | 7.4 | 7.3 | 7.1 |
| France | 0.9 | 0.5 | 0.7 | 0.9 | 0.9 | 2.3 | 2.3 | 1.2 | 7.7 | 8.2 | 8.0 | 7.7 |
| Italy | 0.7 | 0.9 | 0.6 | 0.5 | 1.6 | 2.8 | 2.6 | 1.8 | 6.0 | 5.7 | 6.0 | 6.2 |
| Spain | 2.8 | 2.7 | 2.0 | 1.9 | 2.7 | 3.4 | 3.0 | 2.1 | 10.5 | 10.2 | 9.8 | 9.5 |
| Netherlands | 1.6 | 1.4 | 1.0 | 1.2 | 3.0 | 2.7 | 2.5 | 2.1 | 3.9 | 3.8 | 3.6 | 3.6 |
| United Kingdom | 1.3 | 1.2 | 1.4 | 1.7 | 3.4 | 3.2 | 2.7 | 2.0 | 4.9 | 5.0 | 4.8 | 4.8 |
| Switzerland | 1.4 | 1.2 | 1.6 | 1.5 | 0.2 | 0.7 | 0.7 | 0.8 | 4.3 | 4.7 | 4.6 | 4.4 |
| Central and Southeastern Europe | 2.5 | 2.4 | 2.7 | 2.7 | 4.3 | 4.2 | 4.3 | 3.8 | 4.0 | 4.0 | 4.0 | 3.9 |
| Turkey | 3.6 | 3.4 | 4.1 | 4.6 | 34.9 | 30.3 | 24.9 | 15.1 | 8.4 | 8.4 | 8.3 | 8.0 |
| Russia1 | 1.1 | 0.4 | 1.5 | 1.8 | 8.7 | 6.9 | 5.3 | 4.3 | 2.2 | 2.3 | 2.5 | 2.4 |
| The Americas | ||||||||||||
| USA | 2.1 | 2.1 | 1.9 | 2.2 | 2.7 | 3.2 | 1.9 | 1.8 | 4.3 | 4.2 | 4.5 | 4.7 |
| Mexico | 0.8 | 1.5 | 2.3 | 2.0 | 3.8 | 3.5 | 3.0 | 3.0 | 2.6 | 2.9 | 2.8 | 3.0 |
| Brazil | 2.6 | 2.2 | 2.1 | 2.1 | 5.0 | 5.2 | 4.8 | 3.2 | 6.0 | 5.9 | 6.2 | 6.5 |
| Asia | ||||||||||||
| Japan | 1.2 | 0.7 | 0.7 | 0.8 | 3.2 | 2.2 | 2.3 | 1.8 | 2.5 | 2.5 | 2.5 | 2.5 |
| South Korea | 1.1 | 3.2 | 1.8 | 2.0 | 2.1 | 2.9 | 2.2 | 2.8 | 2.8 | 2.9 | 2.9 | 2.9 |
| China | 5.0 | 4.4 | 4.3 | 4.3 | −0.2 | 1.1 | 0.7 | 1.2 | 5.2 | 5.2 | 5.1 | 5.1 |
| India | 7.3 | 6.9 | 6.5 | 6.4 | 2.2 | 4.6 | 4.1 | 4.0 | 7.2 | 6.8 | 6.4 | 6.2 |
| Total | ||||||||||||
| Advanced economies | 1.7 | 1.6 | 1.6 | 1.8 | 3.0 | 3.2 | 2.2 | 2.1 | 4.6 | 4.6 | 4.7 | 4.7 |
| Emerging economies | 5.1 | 4.7 | 4.7 | 4.8 | 3.0 | 3.8 | 3.2 | 3.0 | 5.7 | 5.6 | 5.4 | 5.4 |
| Global economy | 3.5 | 3.2 | 3.2 | 3.4 | 3.0 | 3.5 | 2.7 | 2.6 | 5.4 | 5.4 | 5.3 | 5.3 |
| For reference: | ||||||||||||
| Export weighted2 | 2.2 | 2.1 | 2.0 | 2.2 | ||||||||
| GDP weighted in USD3 | 2.9 | 2.7 | 2.7 | 2.9 | ||||||||
1 The data forecast for Russia are subject to considerable uncertainty. Russia has only a small weight in the overall forecast.
2 World weighting based on shares of German exports in 2024.
3 World weighting based on gross domestic product in US dollars from 2024 to 2027.
Notes: The black figures represent actual (reported) data. The values for country groups are weighted averages. For weighting real GDP and consumer prices, the respective GDP in purchasing power parities from the IMF World Economic Outlook for the years 2024 to 2027 is used. For weighting unemployment figures in the country groups, the labor force (ages 15 to 64) of each country for the year 2023 is used. The Central and Southeastern European countries include Poland, Romania, the Czech Republic, and Hungary.
Sources: National statistical offices; DIW Berlin Economic Outlook Autumn 2026.
Links and Downloads
DIW Economic Outlook Autumn 2026 in DIW Weekly Report 36/2026